
Patterns of Three Candlesticks: Average Signal Accuracy
- Karan Barwa

- Nov 8, 2024
- 3 min read
Updated: Apr 28
Three-candlestick patterns are powerful tools in technical analysis, providing traders with insights into potential trend reversals or continuations. These patterns typically consist of three candles and are considered to have higher accuracy compared to one- or two-candlestick patterns. By analyzing these formations, traders can make more informed decisions about market movements. However, it is crucial to combine these patterns with other technical analysis tools for confirmation.
Three Stars in the South
The Three Stars in the South pattern is formed during a downtrend.
Appearance: This pattern consists of three candles, each shorter than the previous one, with the minimum price increasing from candle to candle.
Behavior: The Three Stars in the South indicates that the downtrend is weakening and a bullish reversal is possible.
Trading Signal: If this pattern appears on the chart, the price will likely rise after the fall.

Bearish Deliberation
The Bearish deliberation pattern is the opposite of the Three Stars in the South and forms during an uptrend.
Appearance: This pattern consists of three doji candles. The first two candles are approximately the same size, while the third is much shorter.
Behavior: The Bearish Deliberation indicates that the uptrend is weakening and prices may turn down.
Trading Signal: If this pattern forms on the chart, it suggests that the price is likely to fall after growth.

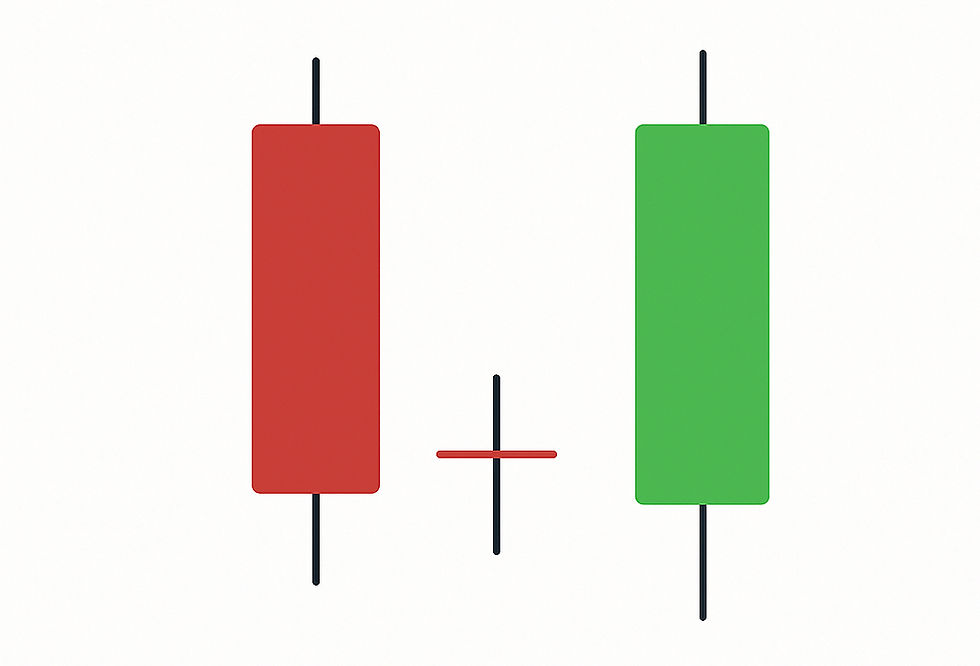
Bullish Doji Star
The Bullish Doji Star pattern begins with a long red candle followed by a doji candle.
Appearance: The doji candle is located below the previous red candle, with a small gap down between them. The third candle is green and has a body larger than that of the first red candle, nearly covering it.
Behavior: The Bullish Doji Star indicates a bullish trend reversal.
Trading Signal: Traders should enter the market on a Bullish Doji Star only if it forms a downtrend.
Bullish Doji Star
Downside Gap Three Methods
The Downside Gap Three Methods pattern forms during a downtrend.
Appearance: It starts with two long red candles separated by a gap down, followed by a green candle whose body covers the gap between the first two candles.
Behavior: This pattern suggests that selling pressure continues.
Trading Signal: If this pattern appears on the chart, it typically indicates that the downtrend will continue.

How to Trade Using Three-Candlestick Patterns:
Identify the Pattern: Look for formations such as Three Stars in the South, Bearish Deliberation, Bullish Doji Star, Downside Gap Three Methods, Three Inside Up, Three Inside Down, Three White Soldiers, or Three Black Crows on your chart.
Confirm with Context: Analyze these patterns about previous price action and overall market trends for confirmation.
Set Entry Points:
For bullish patterns (e.g., Bullish Doji Star, Three Inside Up), consider entering an up trade after confirmation.
For bearish patterns (e.g., Bearish Deliberation, Three Black Crows), consider entering a down trade after confirmation.
Implement Risk Management: Always use stop-loss orders to manage risk effectively and protect your capital.
Conclusion
Three-candlestick patterns like Three Stars in the South, Bearish Deliberation, Bullish Doji Star, Downside Gap Three Methods, Three Inside Up, Three Inside Down, Three White Soldiers, and Three Black Crows are valuable tools for traders looking to identify potential trend reversals or continuations. By understanding these patterns and their implications within the market context, traders can make more informed decisions and enhance their trading strategies.
Summary Table of the above Candle Stick Patterns:
Pattern Name | Description | Trading Signal |
|---|---|---|
Three Stars in the South | Formed during a downtrend; consists of three candles, each shorter than the previous one, with increasing minimum prices. | Indicates a weakening downtrend; price likely to rise. |
Bearish Deliberation | Opposite of Three Stars in the South; consists of three doji candles where the first two are similar in size and the third is much shorter. | Indicates a weakening uptrend; price likely to fall. |
Bullish Doji Star | Begins with a long red candle followed by a doji below it, then a green candle that nearly covers the red candle's body. | Indicates a bullish reversal; enter on downtrend. |
Downside Gap Three Methods | Forms during a downtrend; starts with two long red candles separated by a gap, followed by a green candle covering the gap. | Suggests continued selling pressure; downtrend likely to continue. |
This table summarizes the specified patterns along with their key characteristics and trading signals to help traders quickly reference and apply them in their trading strategies.


Comments