
Mastering Momentum Indicators
- Karan Barwa

- Nov 9, 2024
- 4 min read
Updated: Apr 29
Momentum indicators are essential tools in technical analysis that help traders measure the speed and strength of price movements. By analyzing momentum, traders can identify potential reversals, continuations, or changes in market direction. This blog will explore 15 key momentum indicators, their characteristics, uses, and the signals they provide.
Relative Strength Index (RSI)
RSI is a momentum oscillator that measures the speed and change of price movements on a scale from 0 to 100.
Uses:
Identifying overbought or oversold conditions.
Spotting potential reversal points.
Signals:
Overbought: RSI above 70 indicates overbought conditions, suggesting a potential price correction.
Oversold: RSI below 30 indicates oversold conditions, suggesting a potential price increase.

Stochastic Oscillator
The Stochastic Oscillator compares a security's closing price to its price range over a specific period.
Uses:
Identifying overbought and oversold conditions.
Spotting potential trend reversals.
Signals:
Overbought: Values above 80 indicate overbought conditions.
Oversold: Values below 20 indicate oversold conditions.
Crossovers between the %K line and %D line can signal potential buy or sell opportunities.

Moving Average Convergence Divergence (MACD)
MACD is a trend-following momentum indicator that shows the relationship between two moving averages of a security's price.
Components:
MACD Line: The difference between the 12-day EMA and the 26-day EMA.
Signal Line: The 9-day EMA of the MACD line.
Uses:
Identifying bullish and bearish trends.
Spotting potential reversals through crossovers and divergences.
Signals:
Bullish Signal: When the MACD line crosses above the signal line.
Bearish Signal: When the MACD line crosses below the signal line.

Average Directional Index (ADX)
ADX measures the strength of a trend without indicating its direction.
Components:
The ADX line itself, which ranges from 0 to 100.
Uses:
Identifying whether a market is trending or ranging.
Signals:
Strong Trend: ADX above 25 indicates a strong trend.
Weak Trend or Range-Bound Market: ADX below 20 suggests weak trends or consolidation.
Rate of Change (ROC)
ROC measures the percentage change in price between two periods to assess momentum.
Uses:
Identifying trends in momentum; can signal potential reversals when momentum weakens or strengthens significantly.
Signals:
Positive ROC values indicate upward momentum; negative values indicate downward momentum. Divergence with price can signal potential reversals.

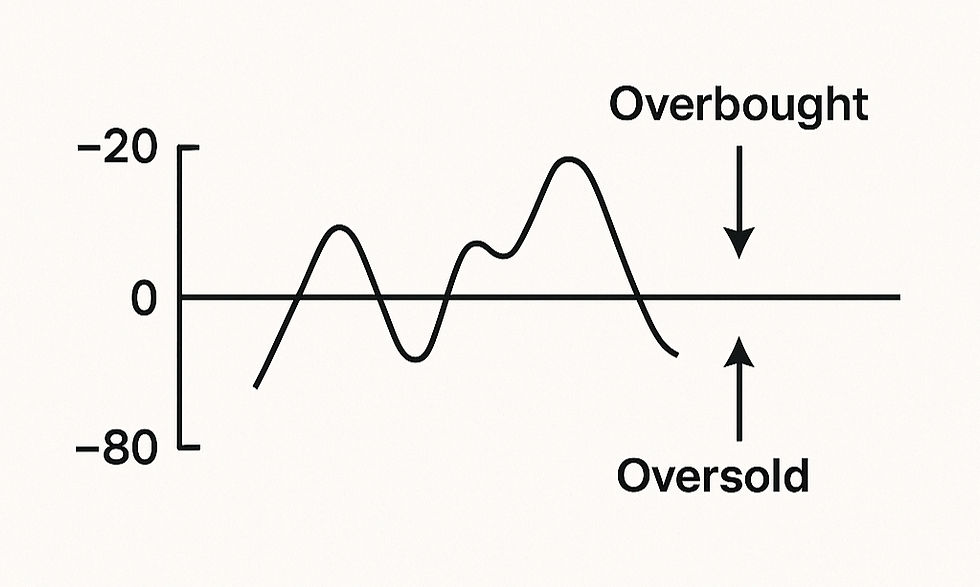
Williams %R
Williams %R is a momentum indicator that measures overbought and oversold levels on a scale from -100 to 0.
Uses:
Identifying potential reversal points by assessing market conditions relative to recent highs and lows.
Signals:
Values above -20 indicate overbought conditions; values below -80 indicate oversold conditions.
Commodity Channel Index (CCI)
CCI measures the deviation of a security's price from its average price over a specified period.
Uses:
Identifying cyclical trends in commodities or stocks; useful for spotting overbought or oversold conditions.
Signals:
CCI above +100 indicates overbought conditions; below -100 indicates oversold conditions.

Momentum Indicator
The Momentum Indicator calculates the rate of change of a security's price by comparing its current price to its previous price over a specified period.
Uses:
Identifying trends and potential reversals based on momentum shifts.
Signals:
Positive values indicate upward momentum; negative values indicate downward momentum. Divergence with price can signal potential reversals.

Chaikin Oscillator
The Chaikin Oscillator combines price and volume to measure the accumulation/distribution line of an asset over time.
Uses:
Identifying buying and selling pressure based on volume trends relative to price movements.
Signals:
A rising Chaikin Oscillator suggests increasing buying pressure; a falling oscillator indicates increasing selling pressure.

Ultimate Oscillator
The Ultimate Oscillator is a momentum indicator that combines short-term, intermediate-term, and long-term price action into one value.
Uses:
Identifying overbought or oversold levels while reducing false signals associated with other oscillators.
Signals:
Values above +70 suggest overbought conditions; values below +30 suggest oversold conditions.

Money Flow Index (MFI)
MFI is a momentum indicator that uses both price and volume data to measure the flow of money into and out of an asset.
Uses:
Assessing buying and selling pressure based on volume trends relative to price movements.
Signals:
MFI above +80 indicates overbought conditions; below +20 indicates oversold conditions.

StochRSI
StochRSI is an indicator that applies the Stochastic Oscillator formula to RSI values rather than prices, providing insights into RSI momentum.
Uses:
Enhancing sensitivity to changes in RSI levels for identifying potential reversals.
Signals:
Values above +0.8 suggest overbought conditions; values below +0.2 suggest oversold conditions.

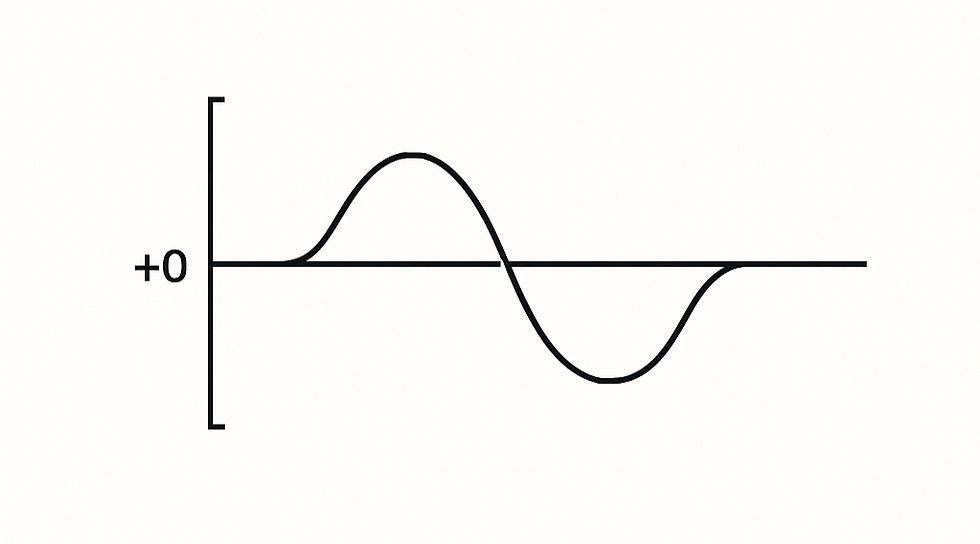
Detrended Price Oscillator (DPO)
DPO removes the long-term trend from prices to focus on shorter-term fluctuations, allowing traders to analyze cycles without noise from longer-term trends.
Uses:
Identifying cycles and short-term trends without interference from longer-term trends.
Signals:
Positive DPO values suggest upward momentum; negative values suggest downward momentum.
Accumulation/Distribution Line (A/D Line)
The A/D Line measures cumulative buying and selling pressure by comparing volume on up days versus down days.
Uses:
Confirming trends by analyzing whether an asset is being accumulated or distributed.
Signals:
A rising A/D Line suggests accumulation (buying pressure); a falling A/D Line suggests distribution (selling pressure).

Conclusion
Momentum indicators are crucial for traders seeking to gauge market strength and identify potential reversal points based on the speed and direction of price movements. By utilizing indicators such as RSI, Stochastic Oscillator, MACD, ADX, ROC, Williams %R, CCI, Momentum Indicator, Chaikin Oscillator, Ultimate Oscillator, MFI, StochRSI, Detrended Price Oscillator, Accumulation/Distribution Line, and others, traders can enhance their ability to make informed trading decisions. Incorporating these indicators into your trading strategy can improve your effectiveness in navigating financial markets.

Comments